The UK Property Market Update for the week
The UK Property Market Update for the week, finishing Sunday, the 18th of January 2025
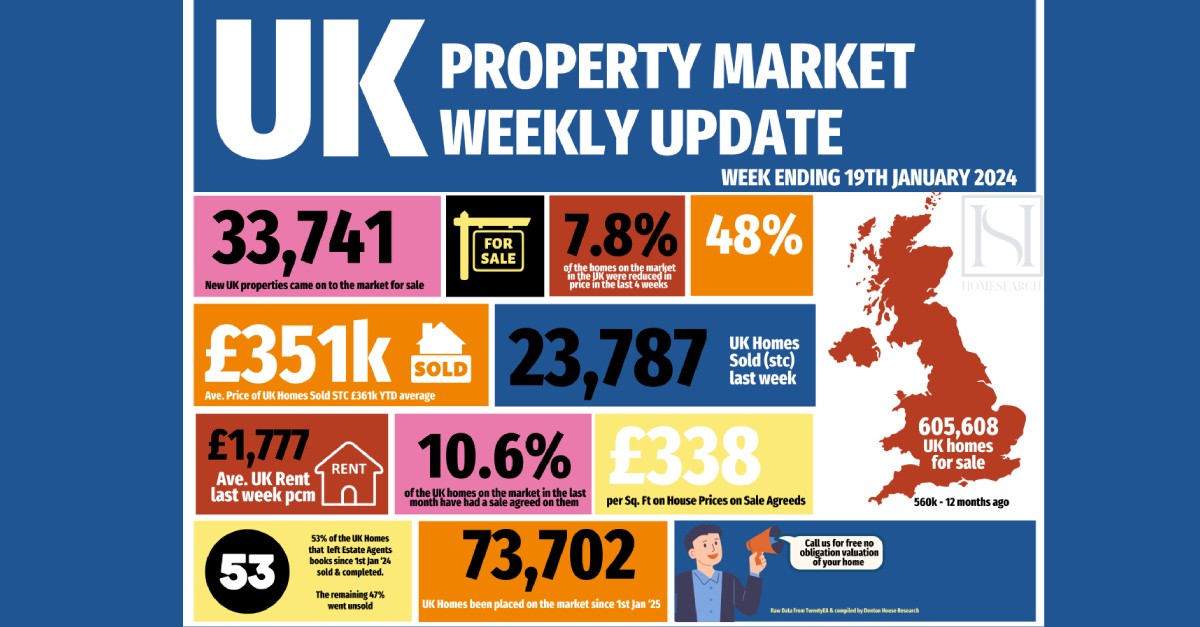
Listings (New properties coming on to the market)- 33.7k UK listings this week (week 2). 19% higher than wk2 in 2024 YTD. 18% higher YTD than 17/18/19 YTD
· % of Resi Sales Stock being reduced (Monthly): 7.8% of Resi sales stock was reduced in December (this stat is monthly in arrears). 11.1% in November. 11.9% & 2024 average and long term 5 year average 10.6%. NB We always get a dip of this stat in December
· Total Gross Sales - - 23.8k UK homes sold stc this week (Week 2) - interesting when compared with last week - 19.2k in Week 1. 48% higher YTD than YTD in 2024. Also, 8.7% higher than 2017/18/19 YTD levels.
· Sale Thru rate (Monthly): - UK Estate Agents sold 10.61% of their Resi sales stock in Dec ’24 (Dec ’23 - 8.79%). 2024 average is 15.3% & the 7 year long term average is 17.9% per month.
·Sale fall-throughs - For the week 2, Sale Fall Thrus (as a % of Gross sales Agreed) 25.4%. The 7 year Long Term weekly Average is 24.2% and it was 40%+ in the two months following the Truss Budget in the Autumn of 2022. Another way of measuring sale fall thrus are the % sales pipeline that fell thru. Done monthly, Agents lost 3.8% of their sales pipeline for the month of December (2024 average 5.36%).
· Resi Sales Stock on the Market - 17.7k this week (average for week normally 14.3k). 54% higher YTD than YTD in 2024. 60% higher YTD 2025 compared to YTD 17/18/19.
·Net Sales - (Monthly Stat) : 605k at end of December (down from 677k at end of Nov). For comparison, Dec ’23 - 560k, Dec ’22 - 481k, Dec ’21 - 342k, Dec ’20 - 543k, Dec ’19 - 545k.
· Resi Sales Sold STC Pipeline - (Units) (Monthly Stat): 441k at end of December. For comparison, Dec ’23 - 359k, Dec ’22 - 373k, Dec ’21 - 468k, Dec ’20 - 548k, Dec ’19 - 310k.
· UK House Prices -As explained in the show, the £/sqft figure foretells and predicts the Land Registry 5 months in advance with an accuracy rating of 92%. Final December figures saw a slight drift in this important metric to £339/sq.ft. For comparison - Nov’s £342/sq.ft, August’s £334/sq.ft, and Dec ’23 at £322/sq.ft. This means house prices have grown 5.28% in the last 12 months.
If you would like to chat about our local property market, feel free to drop us a line on 02085600125 or email us on info@homesearchsales.co.uk
Author Homesearch

Looking to buy?
We'd love to help you on your journey home.
Don't miss out on on the latest properties by registering for our property alerts.
Read What Our
Customers Say

Expert Valuation
We always come armed with evidence and statistics of why we are pricing your property a certain way. We know the importance of getting the initial price of your property right, first time. With our extensive experience we will also explain current market conditions as we want to get our sellers the best price.
What's more, get a free gift with your free expert valuation with one of our experienced Valuer's.
Book a Valuation